The Reference Line button is used to draw a reference line over the plotted chart. The reference line is not based on the query, and is not created using any formula or calculation; rather, it is a design element used to draw a generic positive trend.
- Click here to learn about analysis tools that can be used for things like clustering, outliers, regression lines, and more.
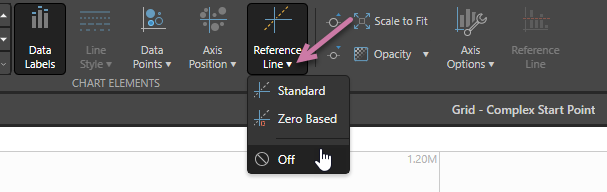
Reference Line
- Standard: The default reference line. A line is drawn from the smallest scale value on the y-axis to the top right corner of the chart.
- Zero Based: A line is drawn from the 0 scale to the top right corner of the chart.
- Off: Reference line is off. For examples of Scatter Charts where the Reference Line is Off, see Axis Position.
Formatting Panel
The Reference Line dropdown list is accessed from the Settings tab of the plotted chart's Formatting panel:
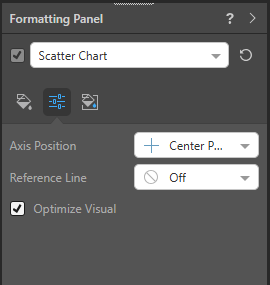
Axis Position Dropdown List
The reference line can also be set from the Component ribbon:
Examples
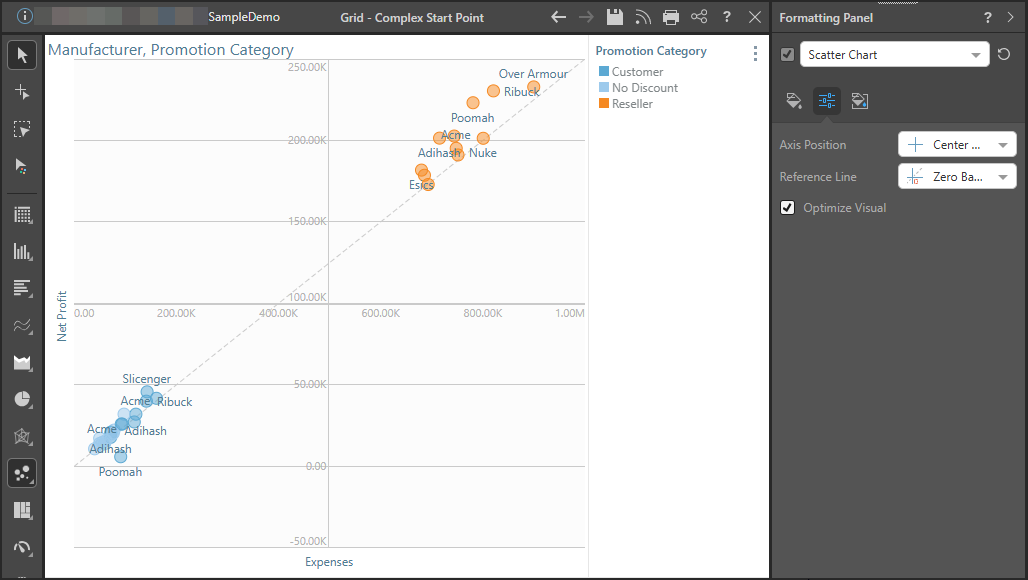
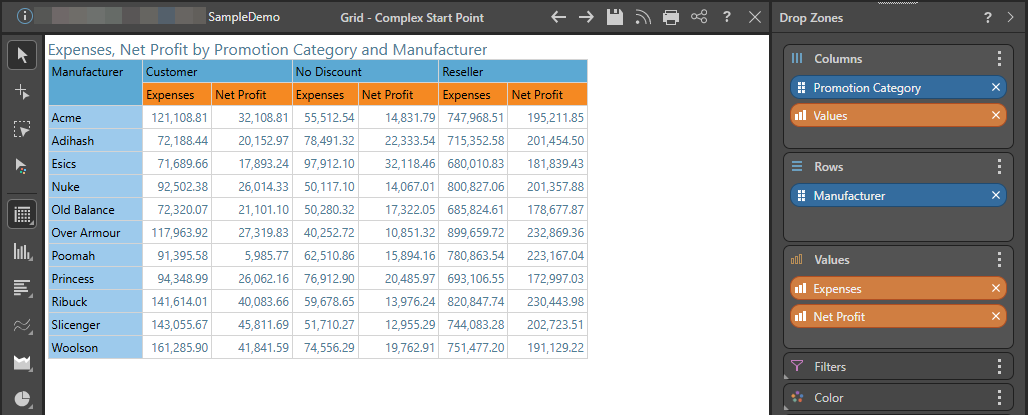
In these examples the following data set was used to plot a scatter chart, with Net Profit on the y-axis and Expenses on the x-axis:
Scatter Plot
Important: The look of the reference line is affected by the Axis Position in the chart.
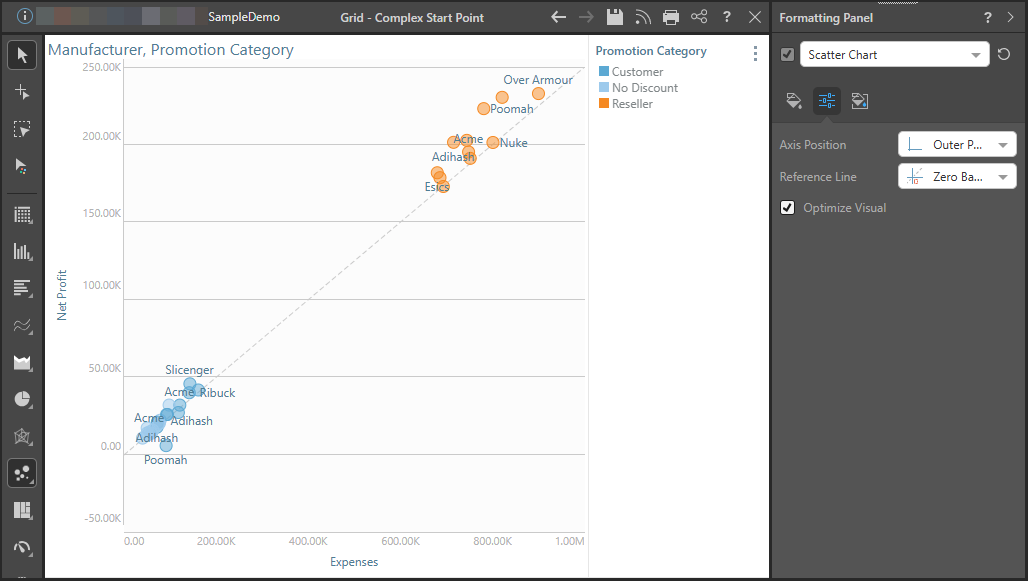
Standard Reference Line, Outer Axis
In this example, the chart was assigned an outer axis position and a Standard reference line was drawn. The line goes from the intersection of the axis in the bottom left of the chart, to the top right corner of the chart.

Zero Based Reference Line, Outer Axis
Now a Zero Based reference line is drawn on the same chart. Both axes display a scale value of 0; the reference line is draw from the 0 that deviates farthest from the axes intersection.
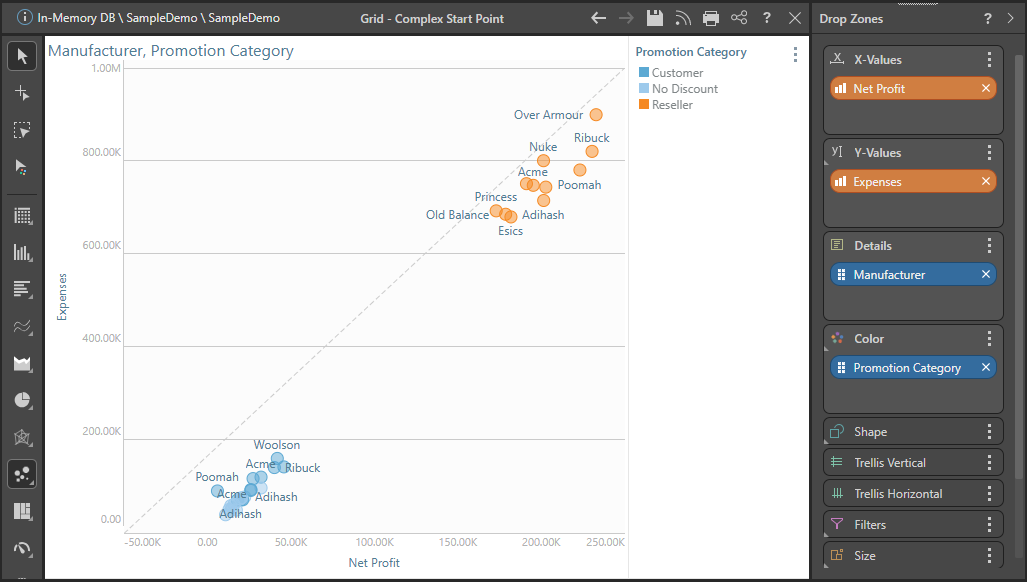
Reversed Axes
For instance, here the axes were switched so that Net Profit is on the x-axis and Expenses on the y-axis. The zero based reference line still starts from the 0 value for Net Profit, starting from the x-axis rather than the y-axis.
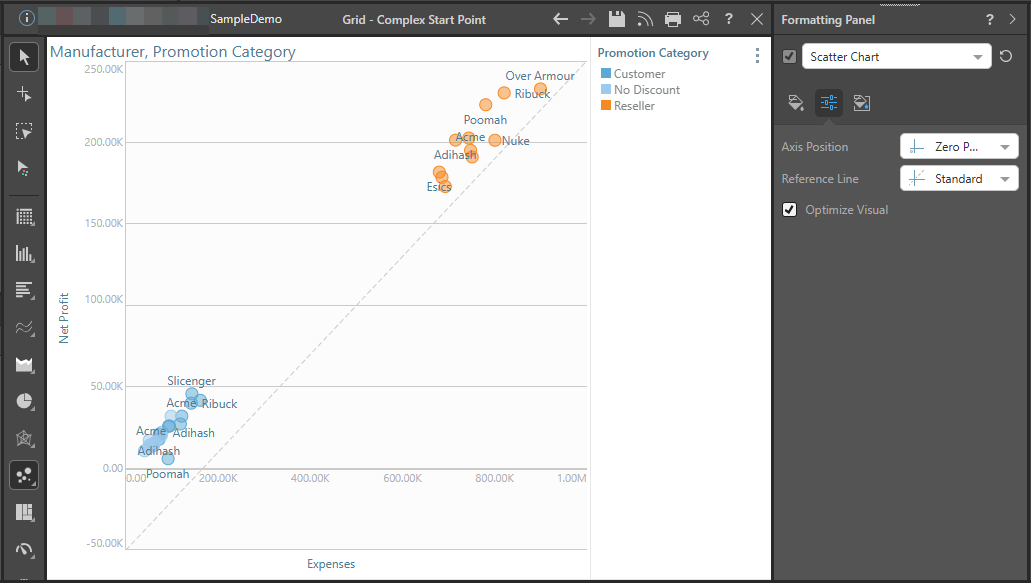
Standard Reference Line, Zero Axis
Here the chart is assigned a zero axis position with a standard reference line. The reference line begins at the smallest value on the y-axis and ends at the top right corner of the chart,
Zero Based Reference Line, Zero Axis
Here the chart is assigned a zero axis position with a zero based reference line. The reference line extends from the intersection of the zero values; if only one axis has a zero value, the zero based reference line should look the same as the standard reference line.

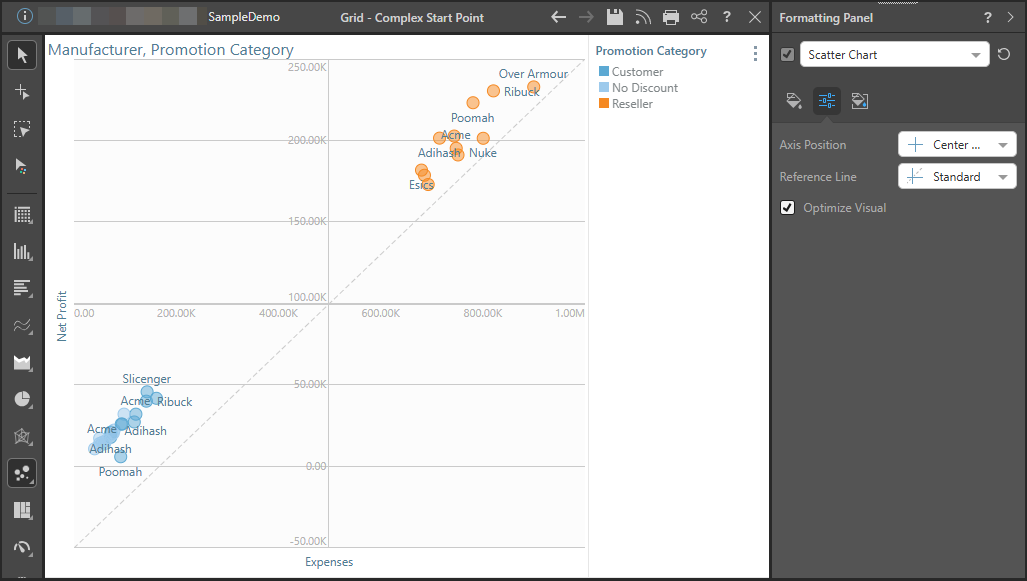
Standard Reference Line, Center Axis
Center axis position with a standard reference line.
Zero Based Reference Line, Center Axis
Center axis position with a zero based reference line.